A dashboard is a way to display various types of visual data in one place. It helps to convey integral information, impacting the process of making business decisions.
The Simple Explanation of Dashboards
The dashboard definition is that it is an information management tool that provides data visualizations. The dashboard receives information from a linked database where it interprets all the different data and presents it in an easy-to-digest visual format such as numbers, graphs, or charts.
Oftentimes, this includes important business metrics like key performance indicators (KPIs) that help stakeholders see and understand important information at a glance.
What is the Difference Between Reports and Dashboards?
Dashboards and reports both play a critical role in analysing and presenting the results. In a broad sense, reports have a narrow focus as they take a deep dive into the data and usually concentrate on a single aspect or item.
When it comes to data dashboards, they present a high-level view by analysing broad amounts of data to answer a single question. They display live data that is dynamically updated which is not the case for reports. Also, a dashboard aids in continual monitoring and interaction with data while a report presents a static view.
Why Do We Need a Dashboard?
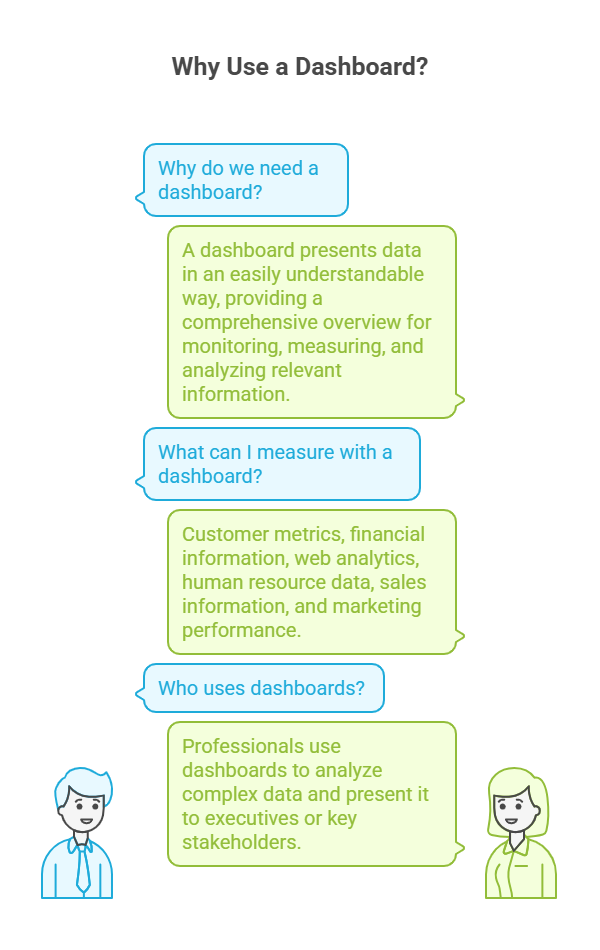
A dashboard helps you by presenting data in such a manner that the end-user can easily understand the key information. It presents a comprehensive overview of data from different sources which is useful for monitoring, measuring, as well as analysing relevant data in important areas.
Use a computer dashboard to measure things like:
- Customer metrics
- Financial information
- Web analytics
- Human resource data
- Sales information
- Marketing performance
Dashboards are usually used by professionals to analyse complex data so that it can be presented to executives or other key stakeholders. Make use of dashboards to identify challenges, opportunities and scope for growth.
What is the Importance of a Dashboard System?
When a business uses a dashboard, it can monitor performance, create in-depth reports and also set estimates and targets for the future. Since a dashboard is interactive and dynamic, and shows real-time data, it helps you make better data-driven decisions.
They increase data accessibility and transparency across businesses and are significantly helpful for regular business users as well as advanced data analysts. You gain high-level insights into performance based on which improve workflow or modify business decisions. Moreover, you can easily optimise campaigns or events for maximum success by updating the dashboard data.
Benefits And Challenges Of The Dashboard
- Visual representation of performance
- Easy way of measuring efficiency
- Data clarity
- Quick identification of data outliers and correlations
- Ability to identify trends and challenges
- Better decision-making and problem-solving
- Total visibility of all systems, campaigns, and actions
- Generating detailed reports
- Accurate forecasting
- Data transparency and accessibility
What are the Different Types of Dashboards?
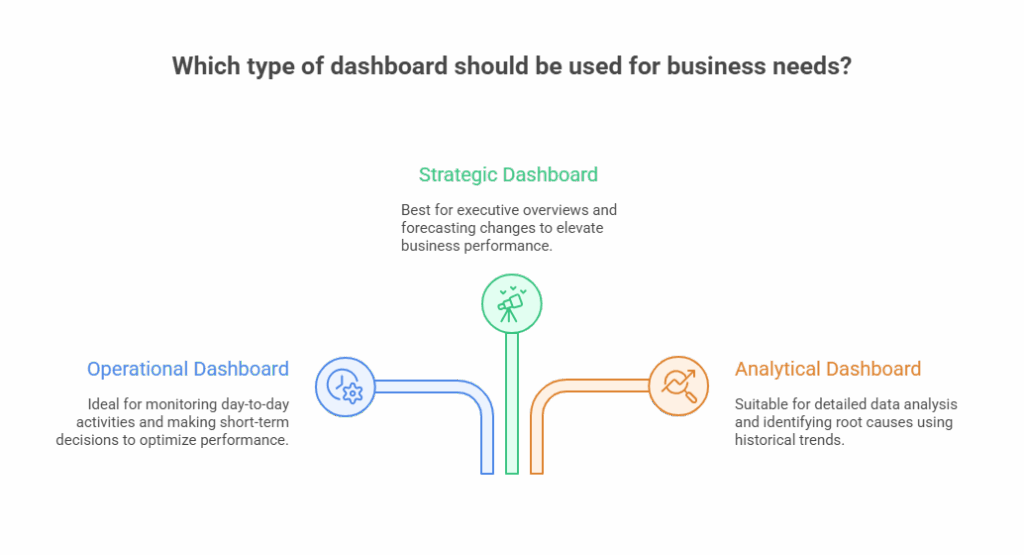
A business can use a dashboard for a variety of reasons. The use case of each type depends on the specific role of the user or their skill sets. The three distinct types of dashboards are:
- Operational Dashboard
These dashboards allow end-users the ability to monitor specific day-to-day business activities, events or processes. Using this dashboard helps in tracking the constantly changing data and enables users to implement any changes or modifications immediately. Operational dashboards are highly beneficial for making short-term decisions to optimise performance.
- Strategic Dashboard
Strategic dashboards, also known as executive dashboards, provide an “at-a-glance” overview of metrics that help in monitoring business performance. The main focus of this dashboard is to aid decision-makers with insights into the opportunities or challenges a business is facing. It also contributes to elevating the performance by forecasting changes in the implemented measures.
- Analytical Dashboard
Analytical dashboards give end-users the ability to identify the details of data and support their root cause analysis. These dashboards are usually used by business analysts and line management as they include comparative analysis and evaluation of historical trends.
What Makes a Good Dashboard?
A good dashboard should have several features that make it efficient and useful in a business.
- User-friendly interface (UI): It is a major requirement as it helps the user navigate the screen, parameters, and other features.
- Dynamic updates: A good dashboard should have a feature that allows the dashboard to be automatically updated when changes are made to the linked database. This feature is incredibly useful in automating a marketer’s bids and budgets in a campaign.
- Business-friendliness: A feasible dashboard is one that can be tailored to specific business needs and KPIs. This includes the ability to share information, multiple formatting and export options, customization alerts are more.
Thus, a dashboard is a helpful business tool that you can use to address business opportunities and challenges. Implement best practices for using these systems and make informed decisions to flourish your business growth.